At some point or another, we’ve all complained about how bloated cars are nowadays. And having owned a Miata myself, I’ve certainly conceded without argument. There’s just something we love about nimble cars that make them so fun and appealing to drive—even if they don’t have a ton of power. Thanks to the SUV and truck boom and safety regulations, today’s cars are bigger and heavier than ever.
That being said, new data released by the United States Environmental Protection Agency suggests that, on average, not only are cars on the road today the most powerful they’ve been in 45 years, but they also have the best power-to-weight (PTW) ratio of all time. Now that doesn’t mean that every car you drive will be a lightweight track monster, but it does mean that modern cars are becoming significantly more powerful relative to their ever-growing weight, and perhaps even more enjoyable to drive than the cars of yesteryear.

Let’s begin by looking at the chart above. This plots the historic fleetwide ratio of horsepower against the weight for all vehicles sold in the United States.
In 2020, the average vehicle tipped the scales at 4,177 pounds and came equipped with 246.9 horsepower—or a ratio of approximately 0.058, which is an improvement of more than 45 percent from the average car built in 1980.
Calculating your own vehicle’s ratio is quite simple; just take the car’s overall horsepower and divide it by the weight (in pounds, in this case). From there you can compare it to the national average for the year that your vehicle was manufactured, or even the vehicles of today. I’ll warn you though, calculating this number for your decade-old hot hatch might make you a wee bit disappointed compared with more modern vehicles.

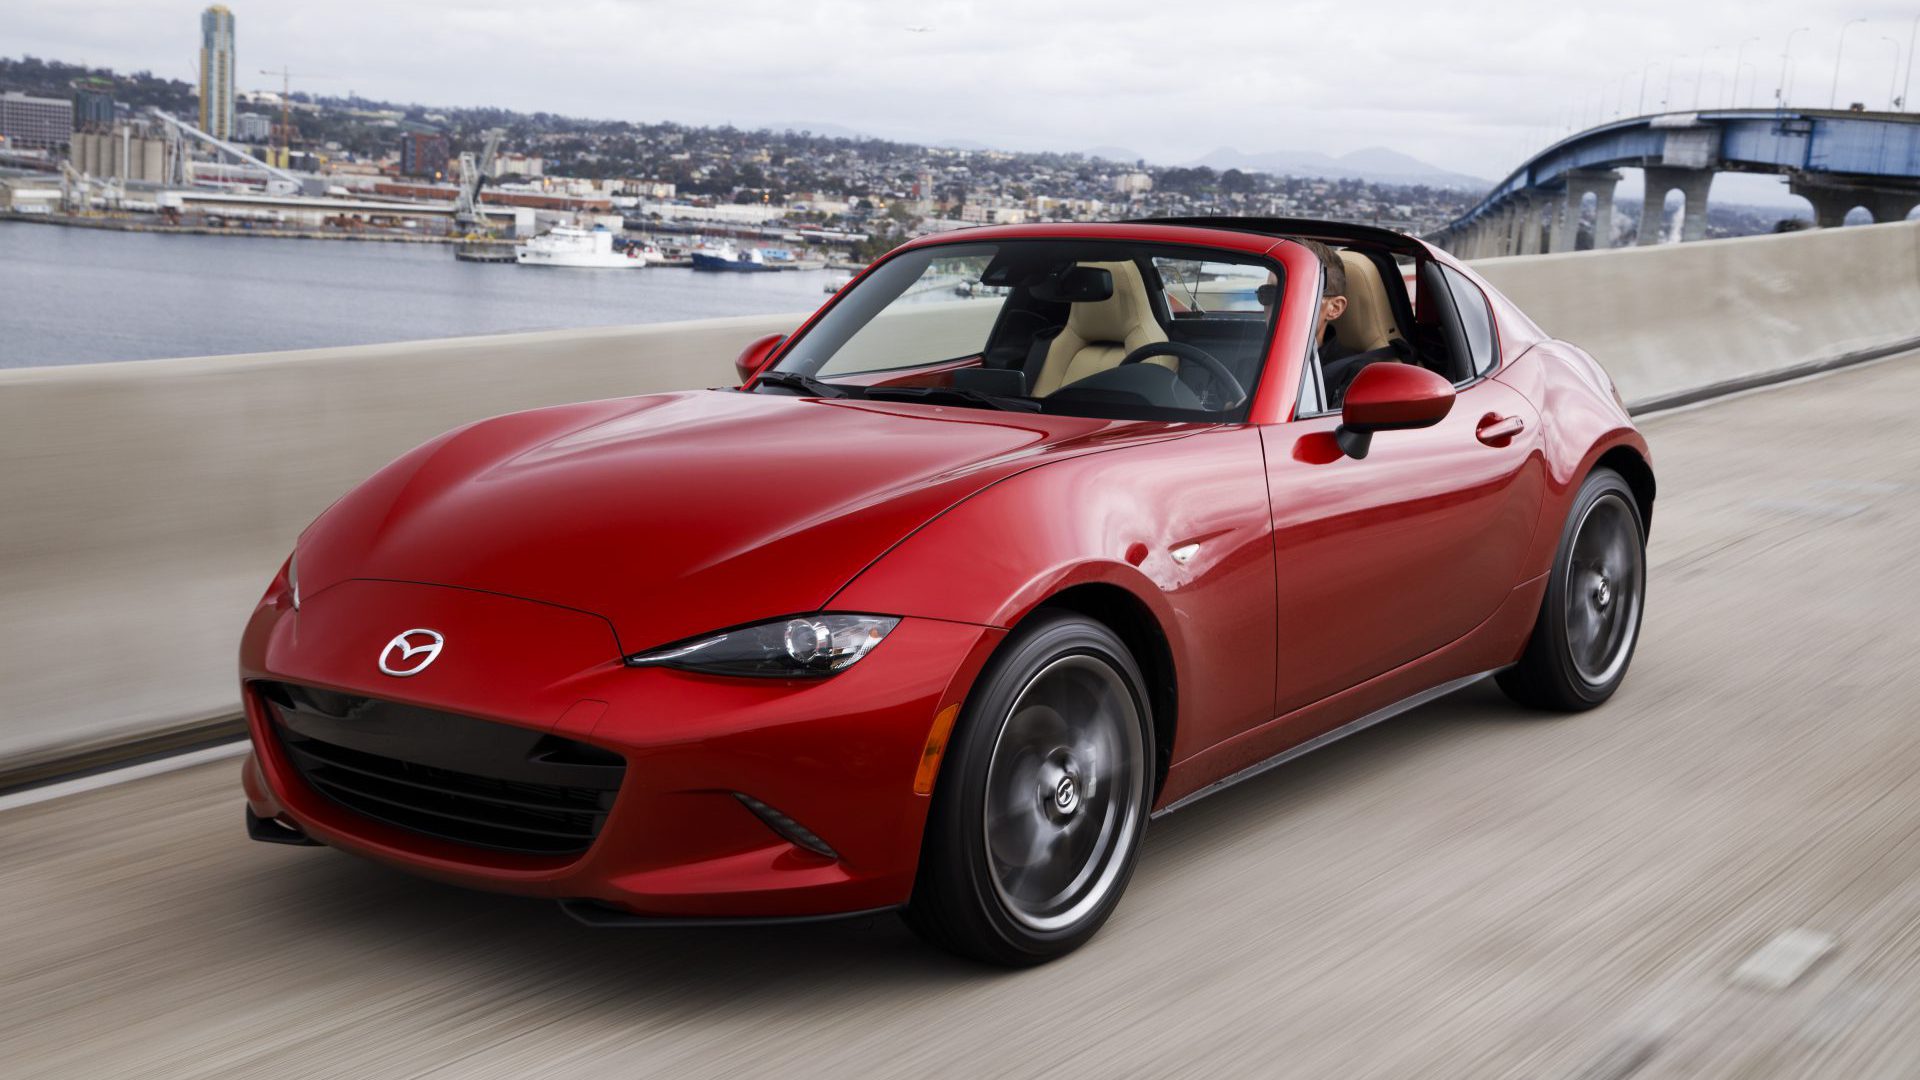
The NA-generation of Miata with the larger 1.8-liter engine, for example, had a PTW ratio of 0.061, meaning that it was significantly ahead of the curve when it was brand new. In fact, the average of cars on the road today still hasn’t met that magic ratio, though it likely will within a few years. Obviously, just because a car has a similar PTW ratio doesn’t necessarily give it the same driving characteristics. The 4,493-pound Dodge Challenger SRT Hellcat Redeye manages a ratio of 0.177 thanks to its 797-hp, supercharged V8, but it fits the bill of a grand tourer rather than a nimble sports car.
What the data does show is how engineers have used technological innovation and efficiency to override the bulk added by safety constraints, buyer habits, tech advancements, and governmental regulation. And the result is a rather impressive selection of cars that can be bought on a dealership lot.

Since the Corporate Average Fuel Economy standards were enacted in 1975, the EPA has been tracking metrics about the vehicles sold on U.S. soil. On any given make and model, this includes not only the fuel economy, but also the vehicle’s weight, horsepower, engine displacement, number of cylinders, acceleration time, and much more. In fact, the data even shows where mandates in CAFE regulations affected vehicle power output after 1977. Manufacturers met the Clean Air Act standards for the first time in 1981, which is coincidentally the lowest-ever point for PTW since this data was collected.
In that time, engines have gotten smaller and become more efficient than their larger counterparts. Since 1975, the average horsepower to displacement ratio has nearly tripled, according to the EPA, and the average fuel economy has more than doubled.

This data is averaged based on the entire U.S. fleet, meaning cars, trucks, SUVs, and minivans can all be lumped into the final numbers, though the EPA does break out its raw data to include vehicle type. You can view the figures for cars-only in these charts we made. Even so, all of the data still follows the up-and-to-the-right trend.
Well, except for one figure: the zero to 60 mph time.
When the EPA started recording the average 0-60 mph time in 1978, it took the average vehicle 13.7 seconds to hit 60 mph when accelerating from a standstill. And that number got worse before it got better due to stricter emission regulations, reaching as high as 16.63 seconds in 1982. As engineers improved engine efficiency, this metric began rapidly improving. Today, the average car will zip from zero to 60 mph in just 7.8 seconds.

It’s probably fair to assume that this trend will continue into the future, especially as electric cars become more prevalent with U.S. consumers. Batteries make these vehicles heavier, and EVs have the ability to put the power to the ground much more efficiently. That’s the reason a Porsche Taycan Turbo S can achieve a PTW ratio of 0.147, or a Tesla Model S Plaid can hit an astonishing 0.214. And the number that will likely continue to drastically decrease will be the zero to 60 mph time, especially since upcoming crossovers like the Mustang Mach-E GT can make the sprint in as little as 3.5 seconds.
Thanks to the electric revolution, that seems to be the future we can expect: EVs that are crazy quick, but also weigh more than ever before. Does anybody have Gordon Murray on speed dial?
Got a tip or question for the author? You can reach them here: Rob@thedrive.com