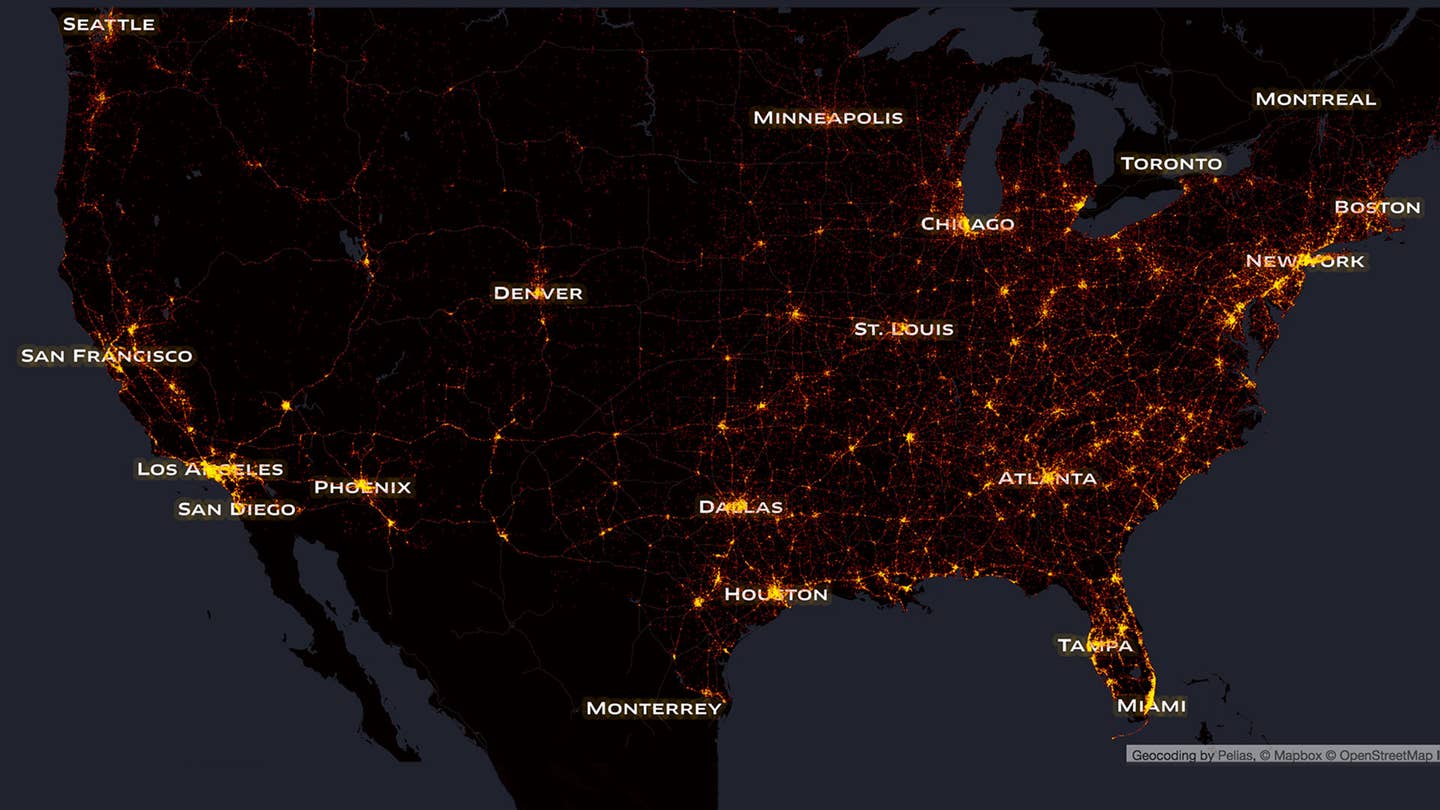
Every Reported Road Death from the Past 10 Years, Visualized
A light for each of the 373,377 fatalities. One of them probably stands for somebody you knew.

Beyond a local news report and lonely white cross, the ghost bike tied to a street lamp, road deaths are a temporary chill, a reminder to keep safe behind the wheel. Concentrated on a heat map of the entire United States, their effects are dizzyingly permanent.
What you see here is the work of data visualization expert Max Galka, who used the Fatality Analysis Reporting System to gather all reported road deaths—be it by car, motorcycle, pedestrian, or cyclist—between 2004 and 2013, the latest data available. You can zoom into any town and see death on that exact corner, from Paul Walker’s L.A. wreck to the intersection a few blocks up from your home. And those lines tracing major highways don’t represent lights of any kind, like most maps of this kind represent. They’re fatalities. And one of them probably stands for somebody you knew.
In total, motor vehicles accounted for 373,377 deaths during the past decade, the majority in the eastern half of the country. That’s more than the population of Pittsburgh; statistically speaking, driving on American roads is more dangerous than serving in combat. Even walking, as evidenced in cities like Los Angeles and New York City, offers no measurable guarantee for safety against accidents.
Alcohol, speed, and distracted driving made up more than half of all fatal accidents during this time. But all's not lost. In 2004, there were 42,836 fatalities. In 2013, the numbers dropped to 32,719, all while the numbers of registered vehicles, miles traveled, and total population have continued to grow. Newer cars are safer. But we’re not invincible.
